
Fibonacci.com
Did you know that there is a sequence of numbers that can help you create wealth? This sequence is called the Fibonacci sequence, and it has been used by some of the world’s richest people to make money. The Fibonacci sequence is also actively used in securities to predict future prices. In this blog post with help of fbsfx, we will discuss what Fibonacci numbers are and how you can use them to create wealth for yourself!
What are Fibonacci Numbers and Lines?
Fibonacci numbers are a mathematical sequence in which each number is the sum of the previous two. The sequence begins with 0, 1, 1, 2, 3, 5, 8, 13, and so on. Fibonacci numbers have many interesting properties, including the fact that they can be found in nature.
For example, the petals of some flowers are arranged in Fibonacci numbers. The sequence also appears in music and art. Fibonacci lines are created by drawing a line between two numbers in the sequence and then extending the line to create a spiral. The spiral can be found in nature as well, such as in seashells. Fibonacci numbers and lines are fascinating examples of how math is all around us!
This sequence was first discovered by an Italian mathematician named Leonardo Fibonacci in 1202. He was studying how rabbits reproduce and found that this sequence accurately describes rabbit breeding patterns. The Fibonacci sequence has since been discovered to apply to many other numerical patterns in nature, including the growth of plants and the spirals of seashells.
How the Fibonacci sequence is used in trading
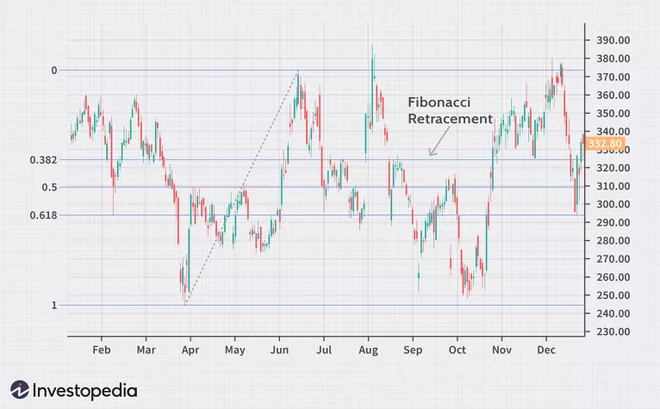
In the world of trading, a Fibonacci sequence is a popular tool that’s used to identify potential support and resistance levels. The sequence is created by starting with 0 and 1 and then adding the two most recent numbers together to arrive at the next number in the sequence.
For example, the next number in the sequence would be 0 + 1 = 1, and the one after that would be 1 + 1 = 2. This pattern continues until infinity. Fibonacci retracement levels are created by taking key Fibonacci numbers and dividing them into the high and low points of a price move.
For example, if the high point is at 100 and the low point is at 50, the Fibonacci retracement levels would be 61.8%, 50%, 38.2%, and 23.6%. These percentages represent how deep a retracement could go before finding support or resistance.
Fibonacci extension levels are created by taking key Fibonacci numbers and dividing them into the distance between the high and low points of a price move. For example, if the difference between the high and low points is 100, then the Fibonacci extension levels would be 161.8%, 200%, and 261.8%. These levels represent how far a price move could go before finding resistance.
Formulas for Fibonacci Numbers and Levels
The Fibonacci levels are a series of horizontal lines that are drawn at certain percentages above and below Security’s price. These percentages are derived from the Fibonacci Sequence. The most popular Fibonacci levels used in trading are 23.6%, 38.2%, 50%, 61.8% and 100%. The 50% level is also referred to as the pivot point.
The common formulas for the Fibonacci numbers are: Fn = Fn-1 + Fn-2 ; F0 = 0; F1 = 1 and so on. To calculate a Fibonacci retracement, divide a Fibonacci number into another one further down the sequence (e.g., 21/34). To calculate a Fibonacci extension, divide one Fibonacci number into another one that precedes it in the sequence (e.g., 55/89).
The Difference Between Fibonacci Numbers and Gann Numbers
When it comes to technical analysis, there are a lot of different tools that traders can use to try and predict future price movements. Two of the most popular methods are Fibonacci numbers and Gann numbers. So, what’s the difference between these two approaches?
Fibonacci numbers are based on the Fibonacci sequence, which is a series of numbers where each number is the sum of the previous two. This sequence can be found in nature, and many traders believe that it can also be used to predict market movements.
Gann numbers, on the other hand, are based on another numerical sequence known as the square of nine. This sequence was discovered by W.D. Gann, a well-known trader who developed several different technical analysis tools. While both Fibonacci numbers and Gann numbers can be used to predict market movements, they’re based on different numerical sequences and have some different applications.
Conclusion
Fibonacci numbers are a popular tool that traders use to identify potential support and resistance levels. There are many strategies for determining market movements and an experienced trader always uses several schemes to achieve results. After reading this article you should know a bit more about what Fibonacci numbers are for. By doing a little research on other strategies, you will be able to improve your trading skills. Good Luck!